
Beyond the handover.
Safe water is only the beginning.
The real measure is what happens next. We return to households to understand how filters are used, how well they keep working, and where continued support makes a difference.
Documented programme delivery · repeated household monitoring · tracked behaviour change
initially provided
through household delivery
across two provinces
Measured beyond the event
The reality of
rural water access.
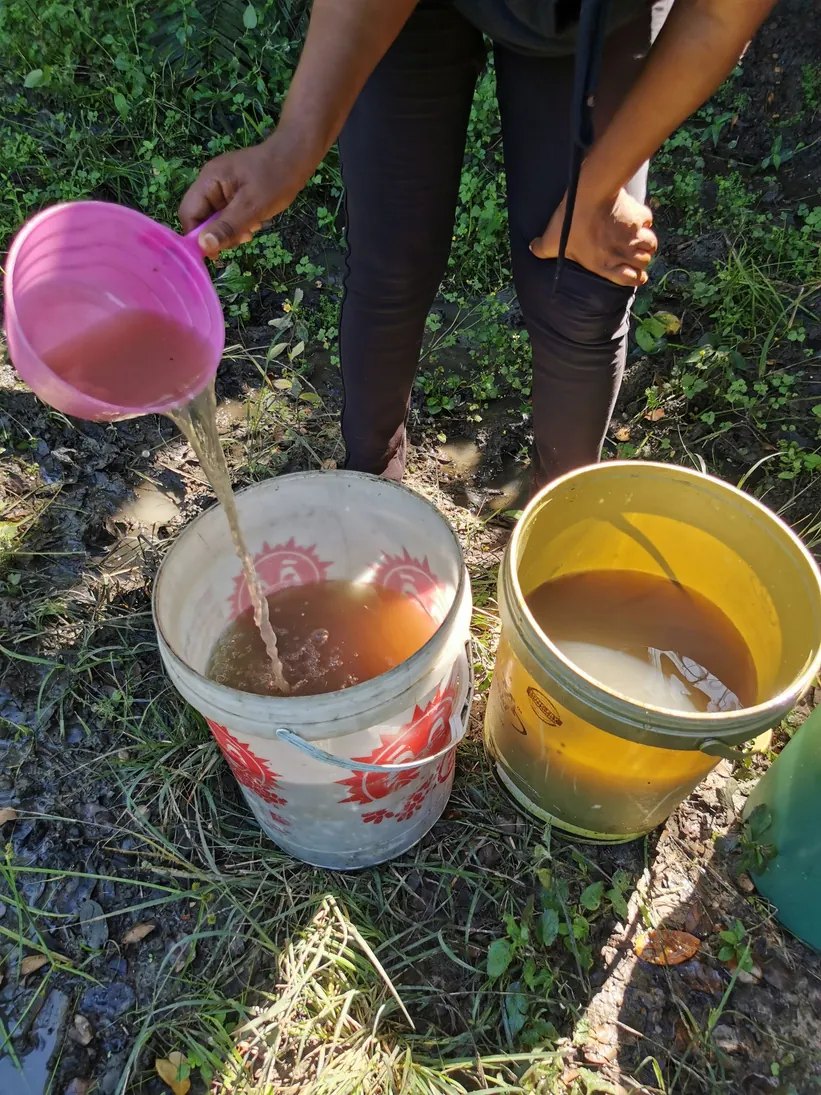
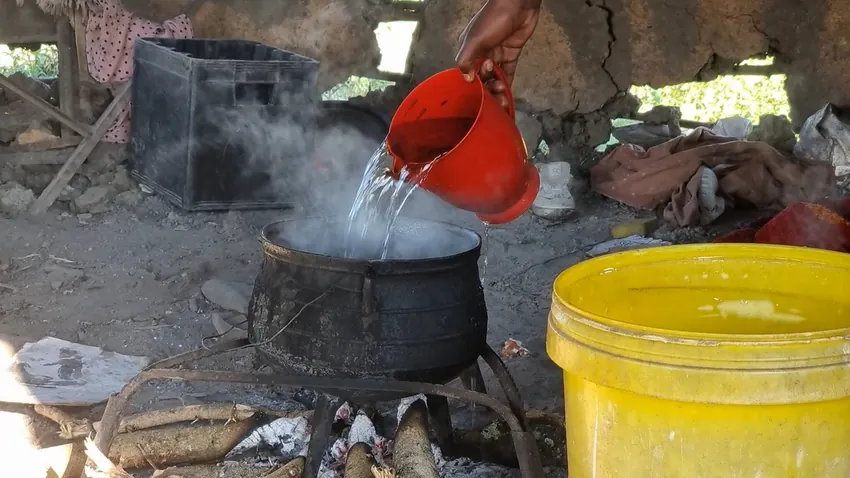
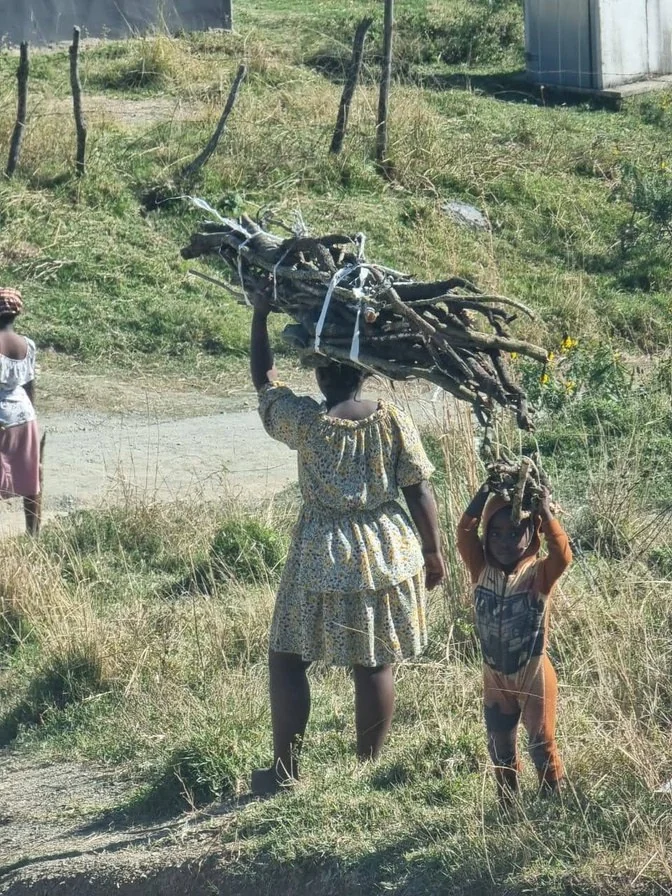
In the monitored Eastern Cape communities, many households relied on untreated rivers, springs and dams, sometimes shared with livestock and vulnerable to contamination. Boiling was the main way families treated drinking water, usually using firewood.
natural water sources
water begins.
276 households relied on rivers, springs or dams.
Explore the source categories belowAll recorded primary drinking-water sources in the monitored cohort were untreated at source.
at registration
Water access is a
family story.
The monitored households represent 1,678 people. More than half were aged 18 or younger at registration.
923 people in the monitored households
Average recorded household size: 5.1 people.
Built on trust.
Delivered together.
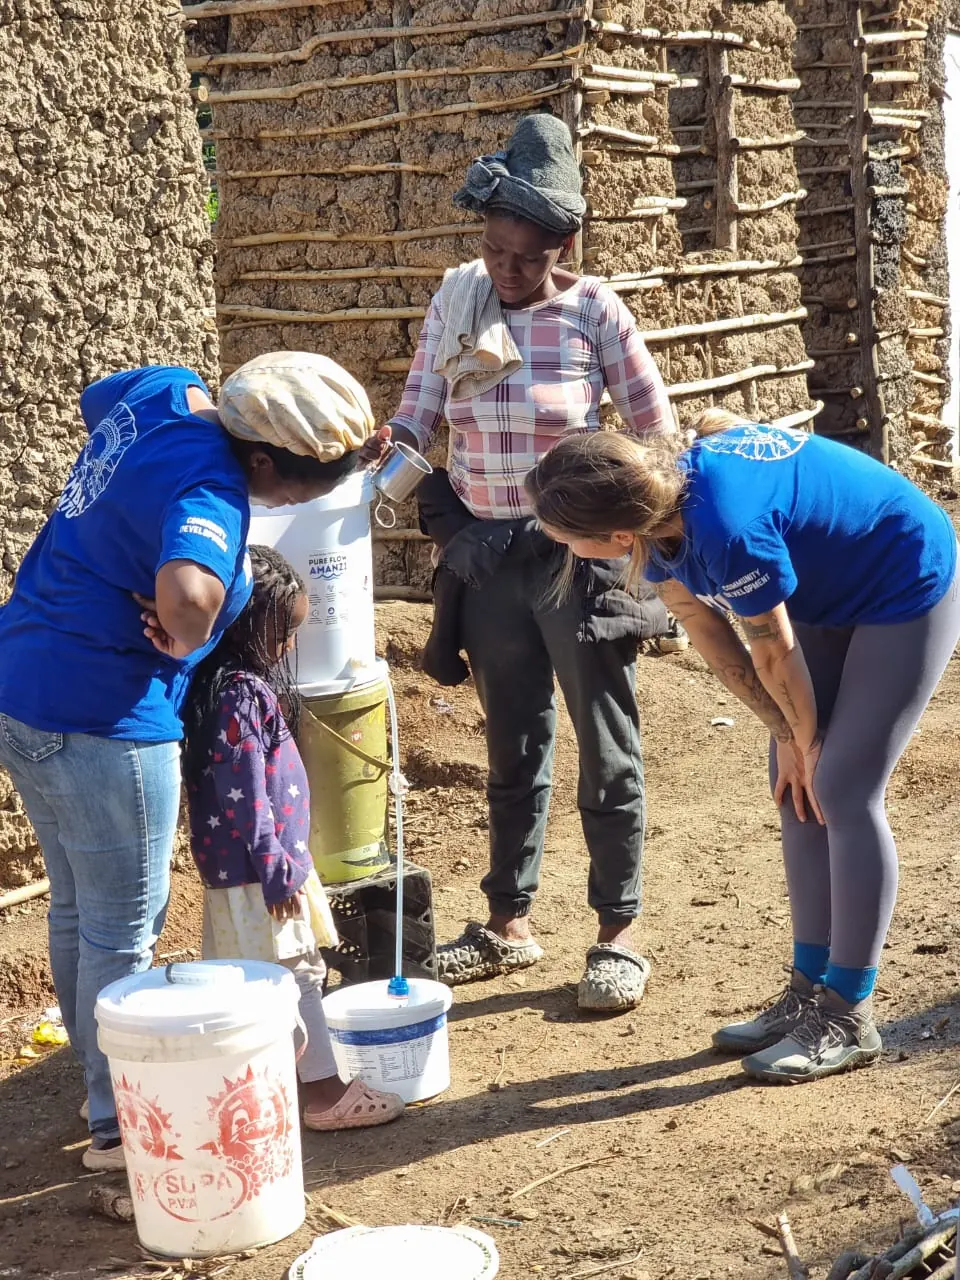
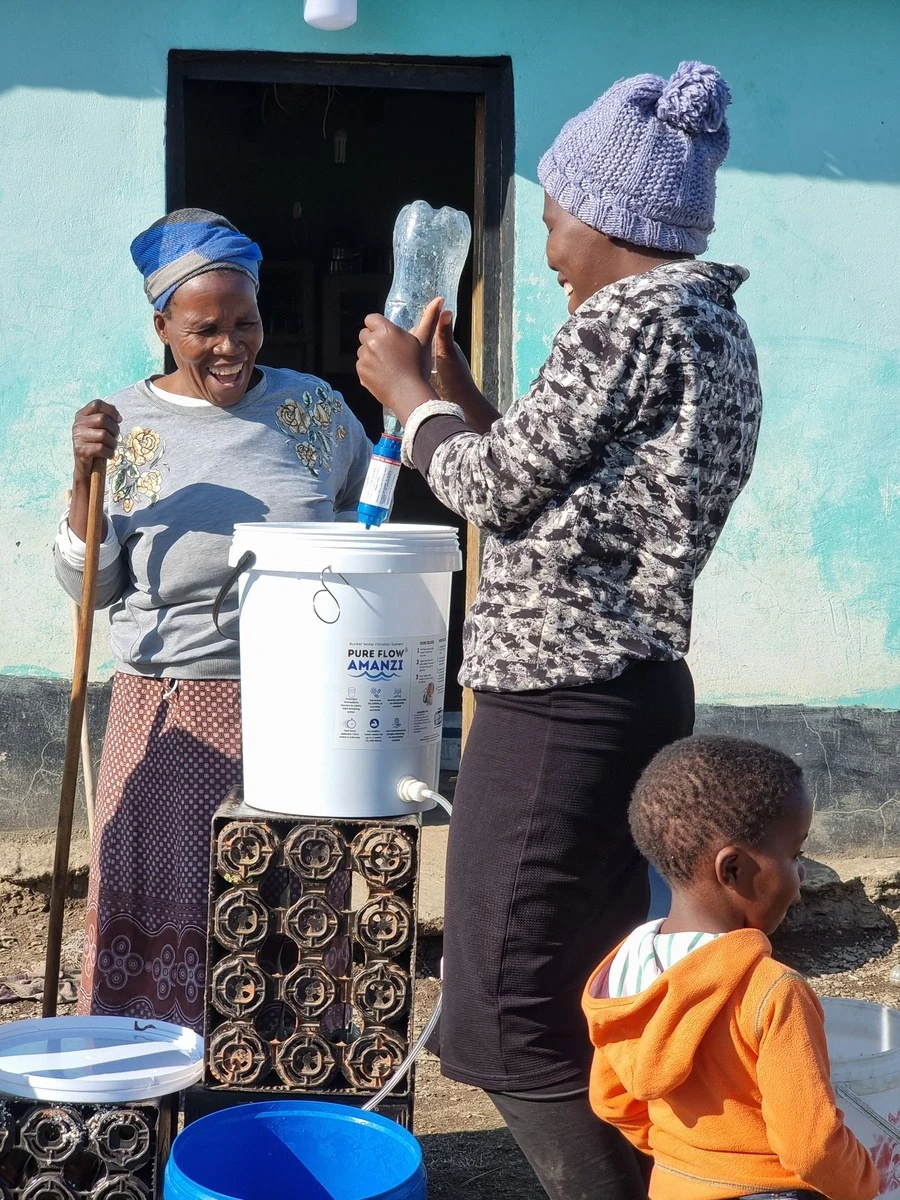
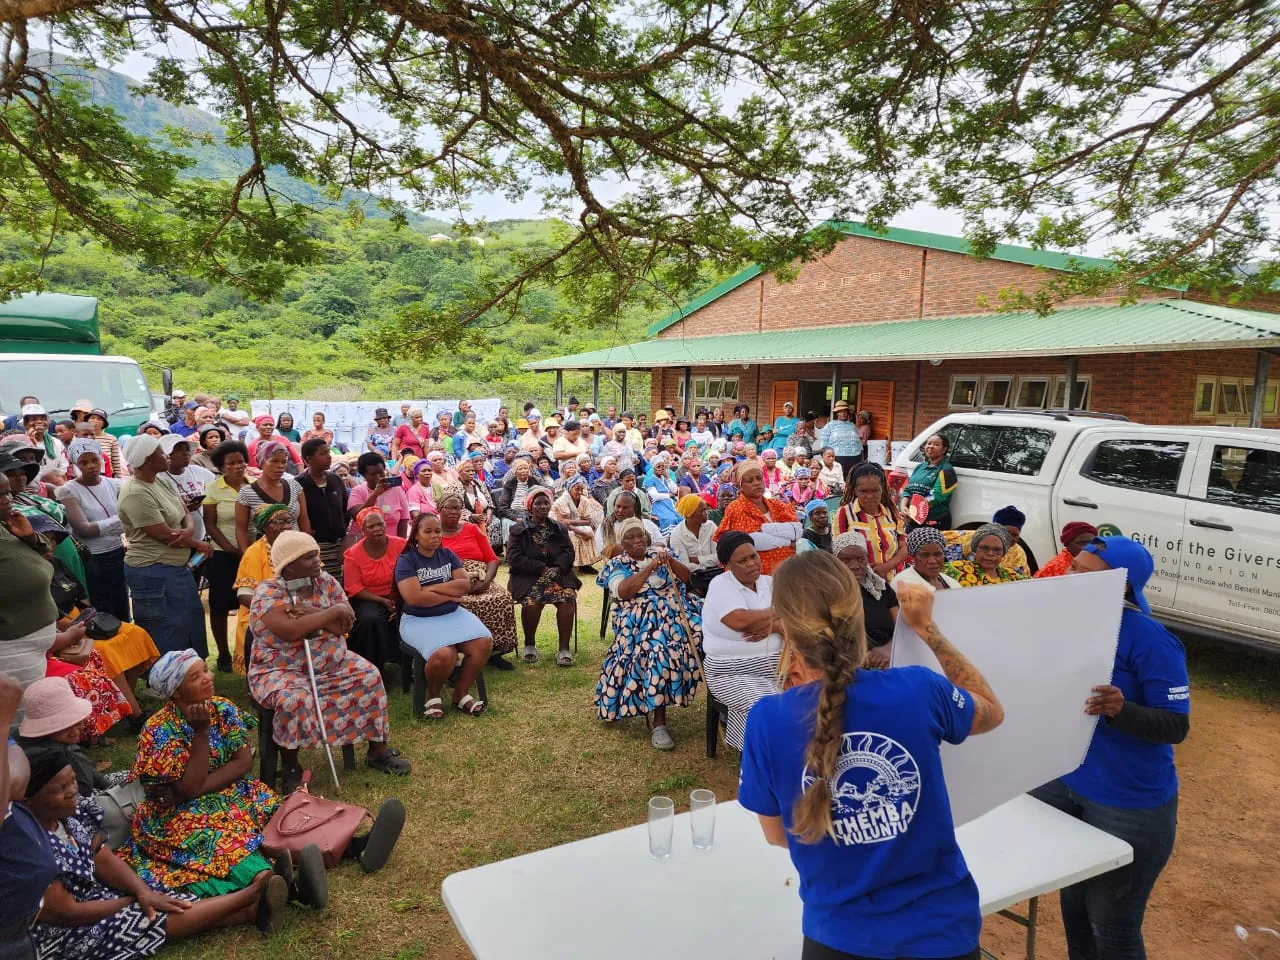
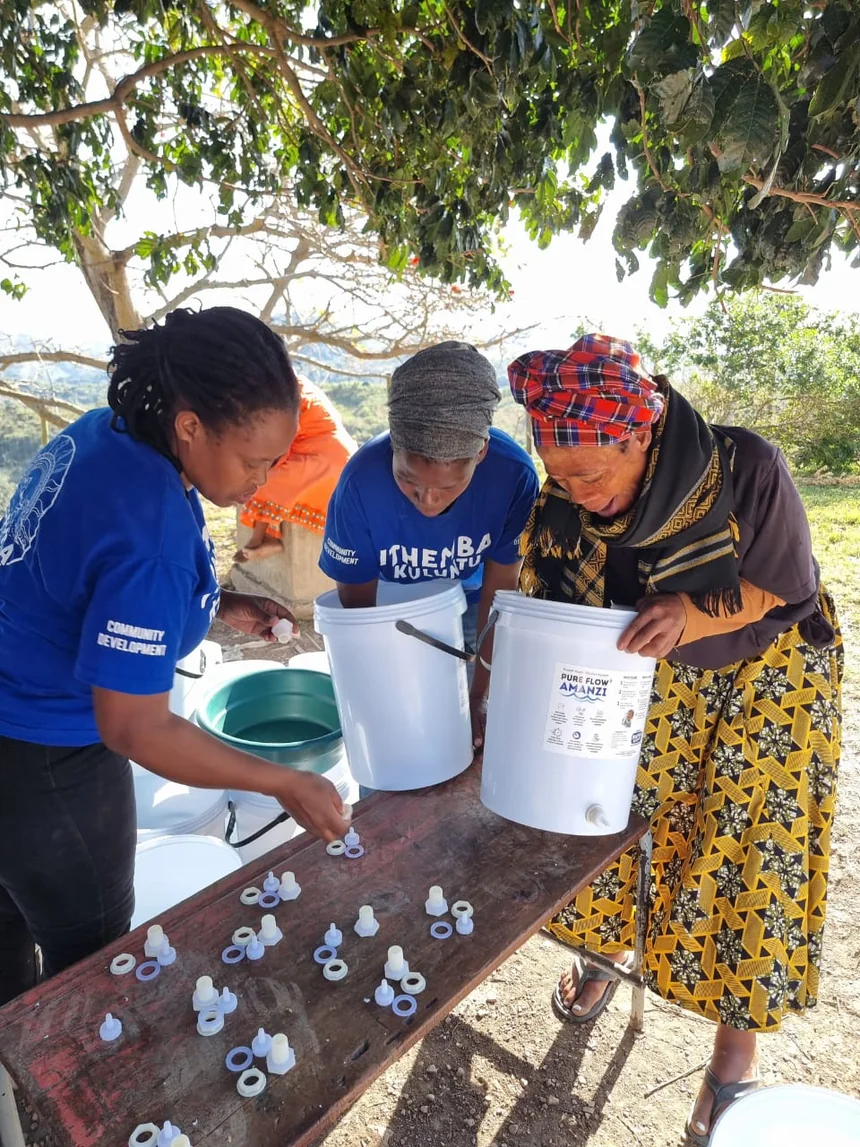
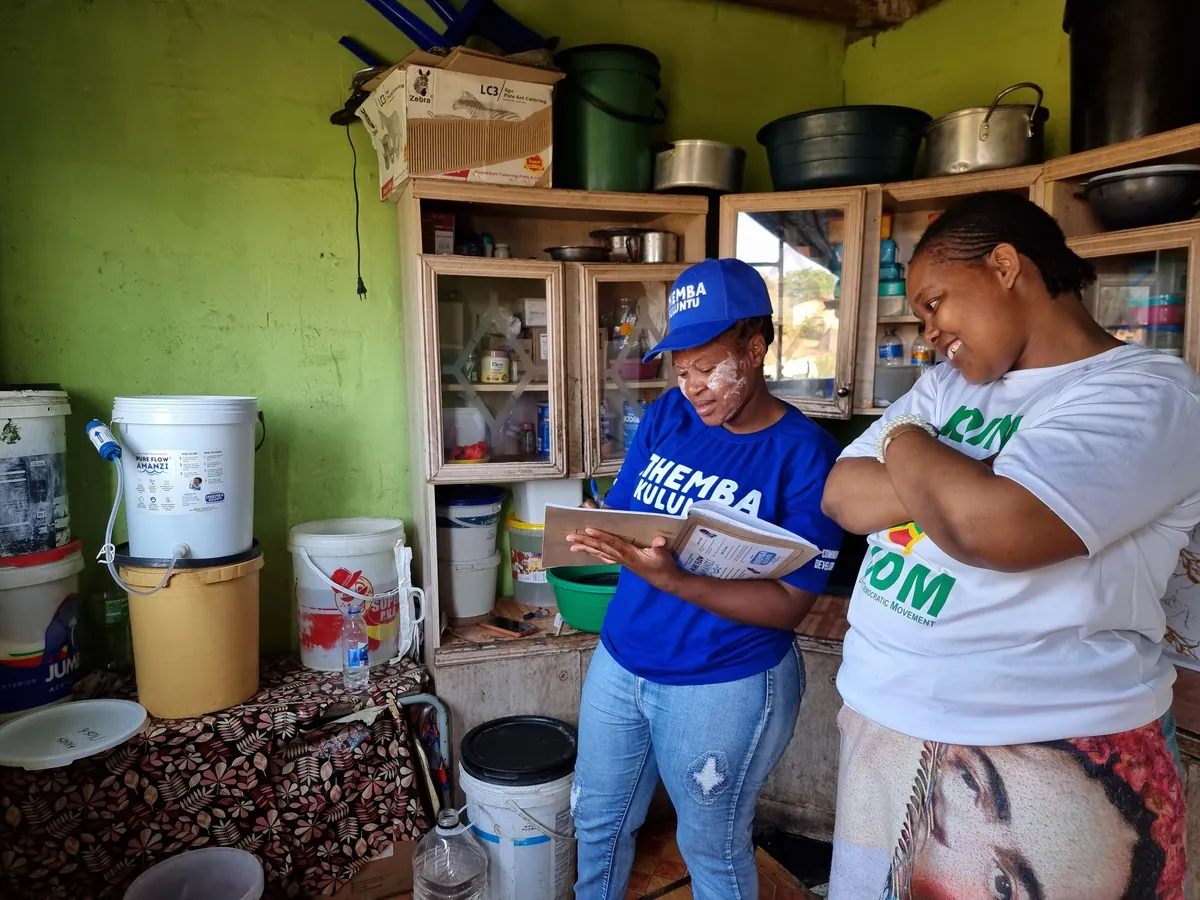
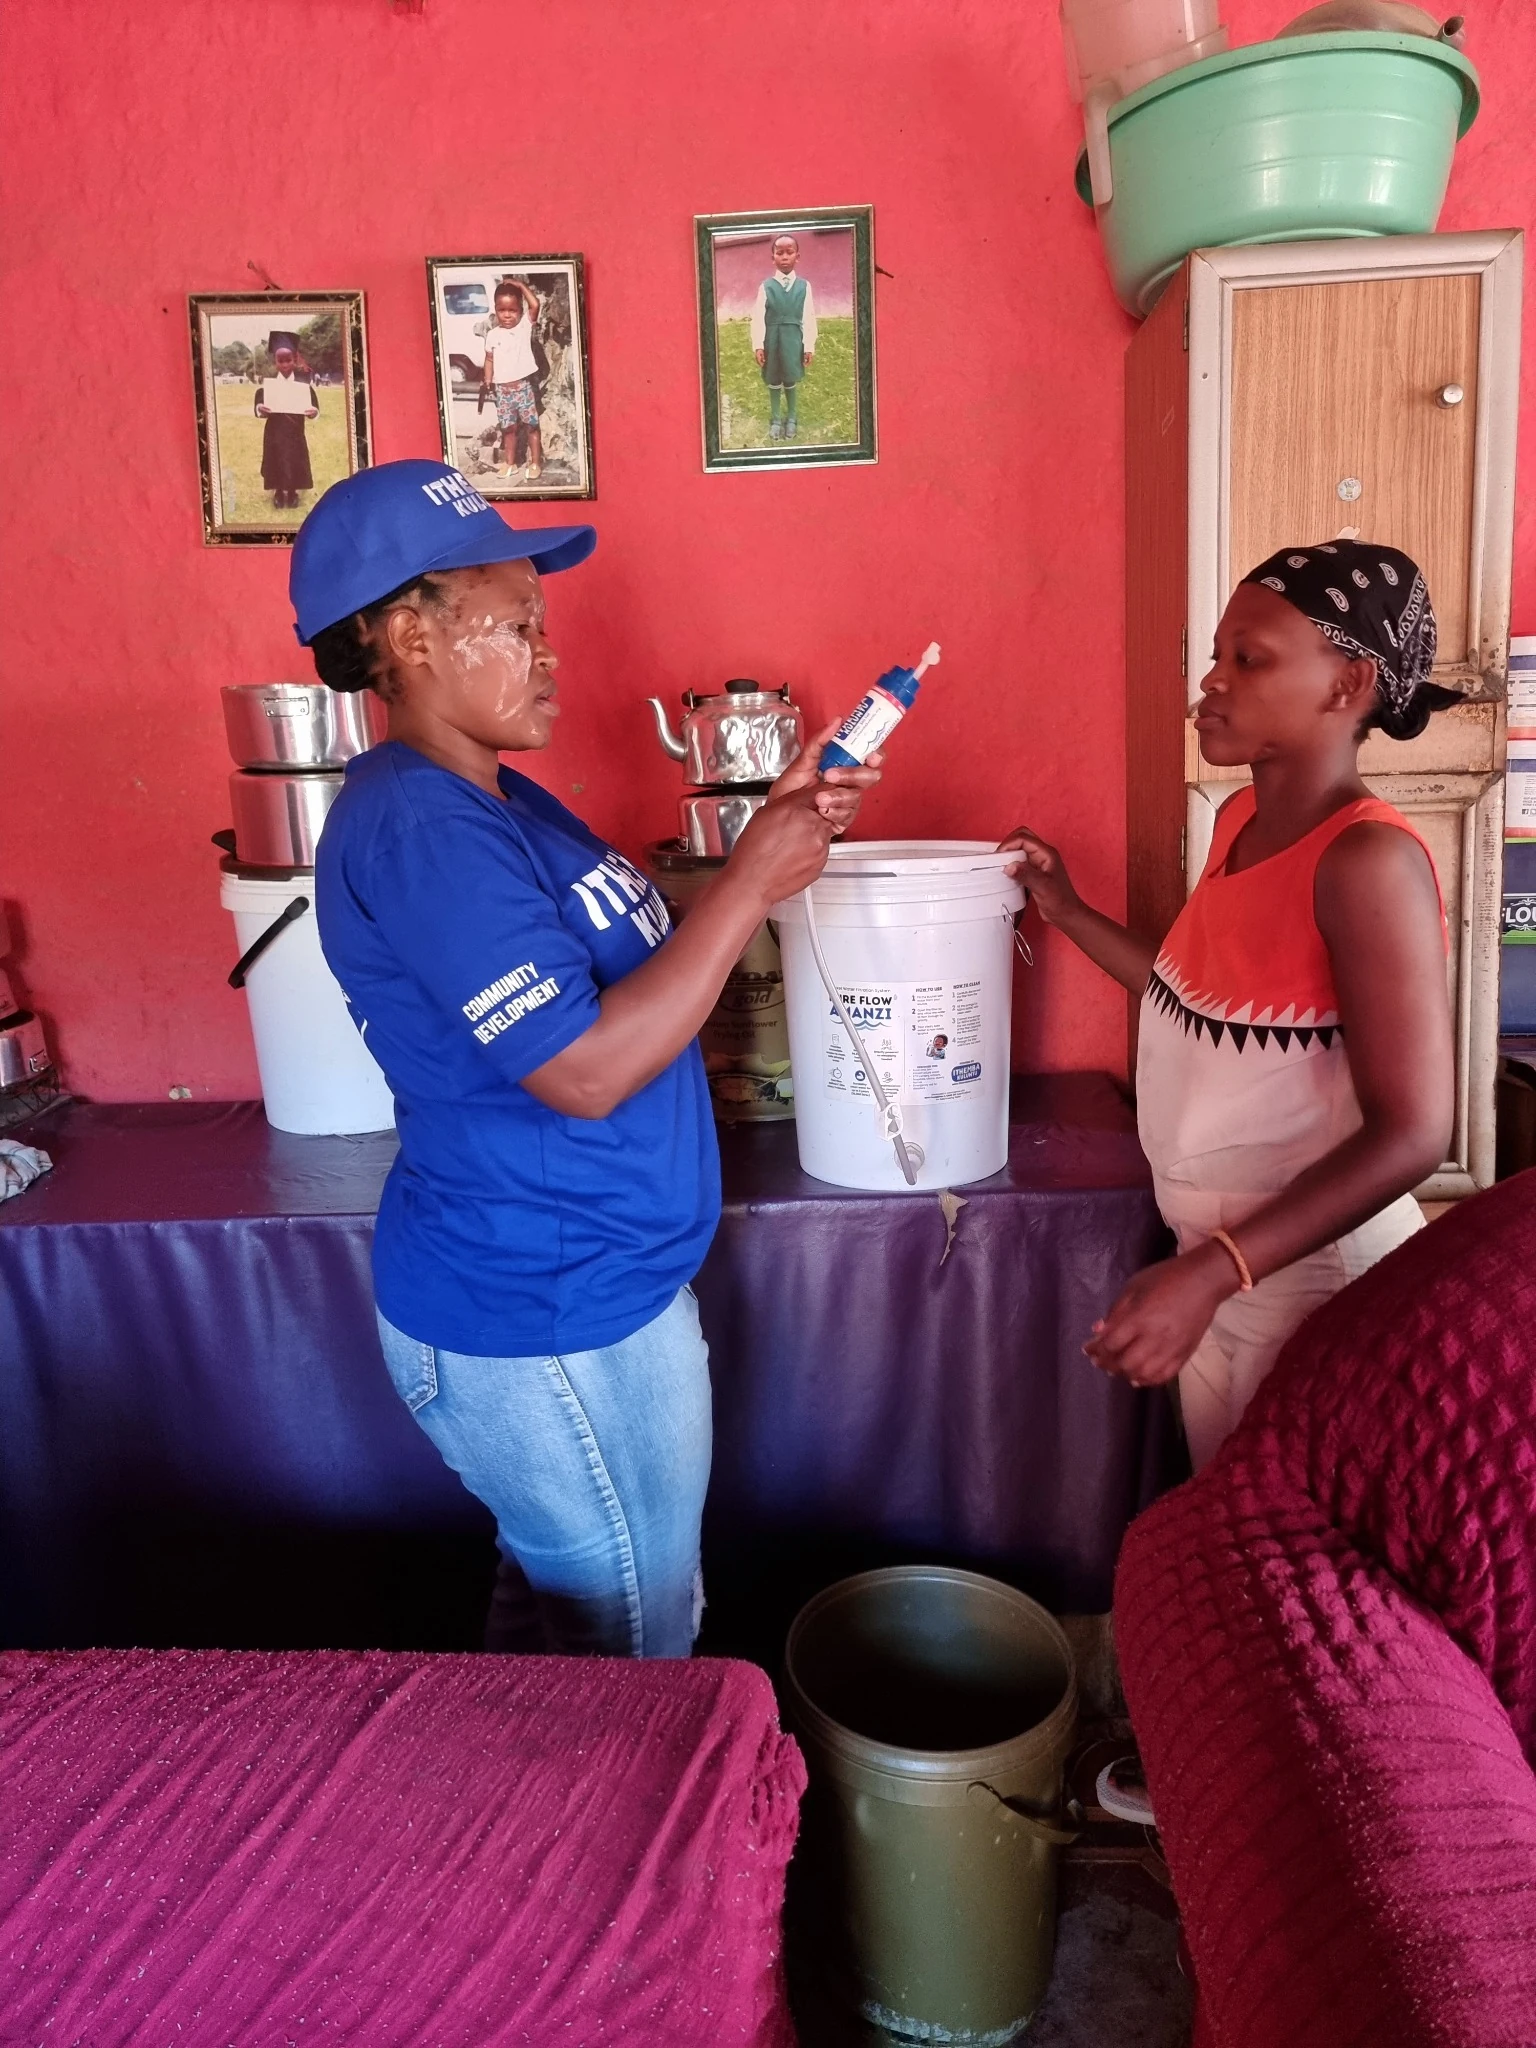
Safe-water delivery is built around local mobilisation, practical WASH education, user training and registered household handovers. Each event is documented, and follow-up continues after distribution.
rollouts
supported
implementers trained
24 community rollouts, 3 ECD activities and 2 implementation trainings. KwaZulu-Natal community rollouts were implemented in partnership with Gift of the Givers, with support from Star Foundation.
Explore the programme Impact Map 29 events · locations · field photographsFrom boiling
to filtration.
Of the households that had relied on boiling at registration and were reassessed, almost all reported using PureFlow as part of their drinking-water treatment routine.
252 of 268 reassessed former boiling households reported using PureFlow, either alone or with occasional boiling.
Still working.
Still in use.
We went back, then went back again. Two follow-up rounds show how household filter use, functionality and safe practices developed over time.
System placement, user training and WASH onboarding
Initial household use and function assessment
Repeat monitoring in 314 households
& in use
both visits
Strong performance,
well beyond delivery.
Eastern Cape monitoring · 314 reassessed households
What changed between visits?
Four key monitoring indicators in the same 314 reassessed households.
Two improvements stand out: reported daily use rose by 7.6 percentage points, while active use with correct practices rose by 4.5 points.
Support that continues
beyond delivery.
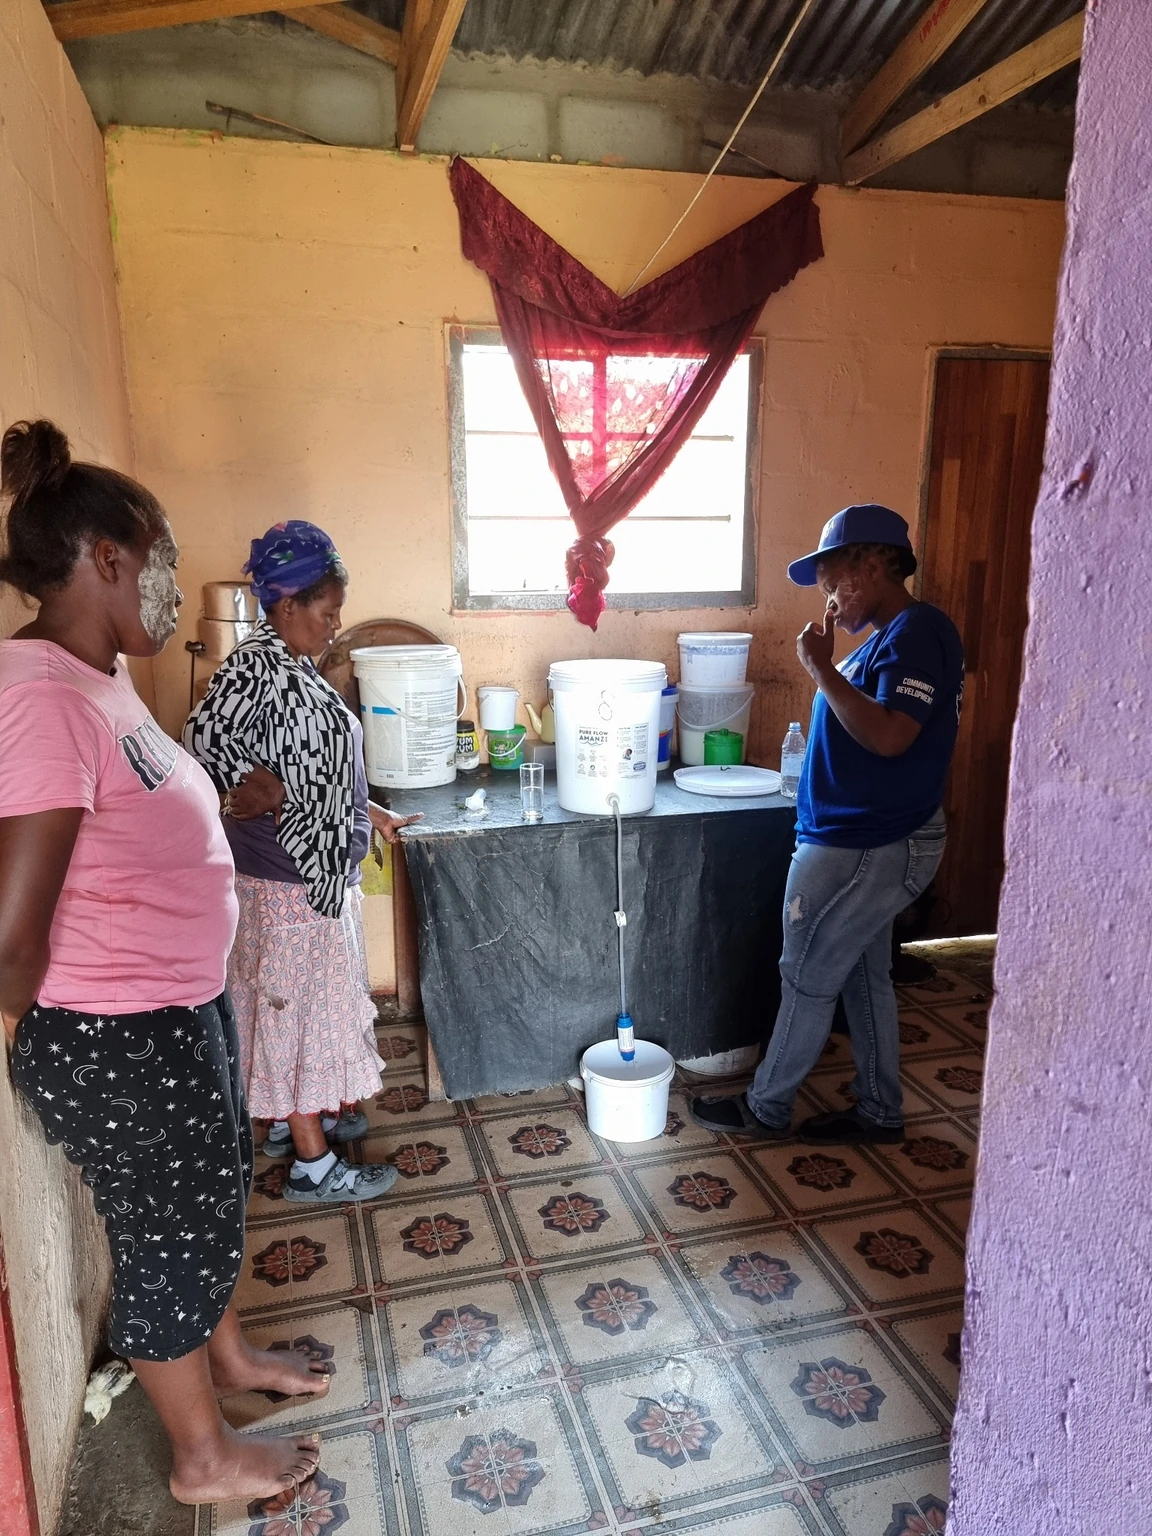
Monitoring is not only about collecting information. Field visits identify the guidance, maintenance and practical interventions that help households keep using their systems.
Support needs fell between follow-up visits.
82.2%needed no corrective action at second follow-up 258 of 314 reassessed households
Most support was
practical guidance.
Primary aftercare needs among the 56 households requiring support at the second visit.
Reliable water where
learning begins.
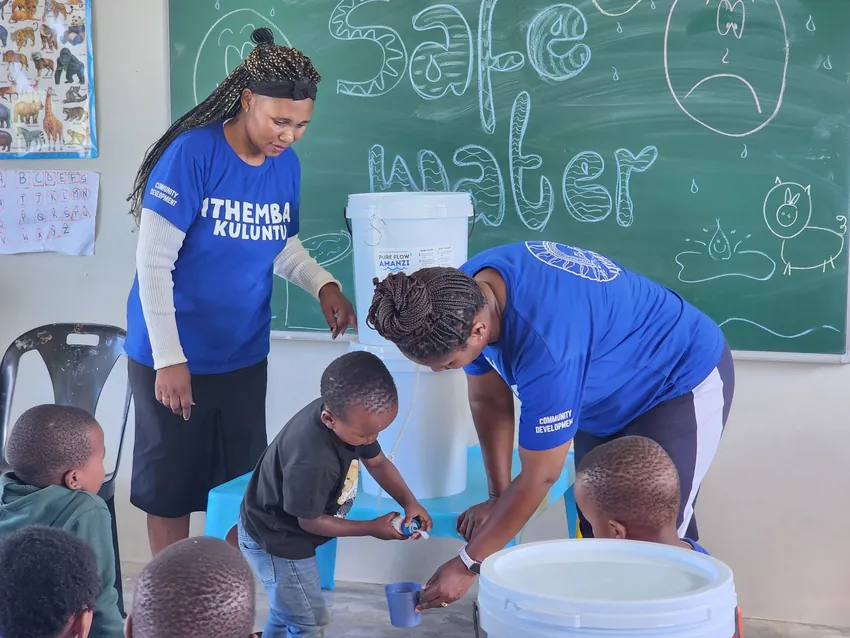
Two supported early childhood development centres bring safe-water systems and practical WASH learning into everyday routines for children and caregivers.
Correct operation and safe storage were observed at both centres, at both follow-up assessments.
reached
practitioners
installed
The evidence
behind the results.
Programme records connect household registration, repeat visits, filter checks, household reports and follow-up actions. The monitoring approach makes changes over time visible.
monitored
rollout cohorts
sampled in those cohorts
second follow-up
Grounded in repeat visits.
Our structured monitoring approach is aligned with the WHO/UNICEF Toolkit for Monitoring and Evaluating Household Water Treatment and Safe Storage, combining baseline assessments, repeated household follow-ups, reported practices and direct field observations.
How were households selected?
Households were randomly selected from registration lists across all 12 Eastern Cape community rollout cohorts in proportion to cohort size. Where selected households were unavailable, replacements were also randomly selected.
What was measured at each visit?
Households reported treatment choices and use frequency. Field teams recorded filter presence and functioning, signs of recent use, correct operation, backwash knowledge, safe storage, and the primary aftercare action required. The four comparisons above use the same 314 reassessed households.
How did the follow-up rounds work?
All selected households completed a first assessment, an average of 6.9 months after handover. Of those, 314 completed a second assessment, an average of 18.8 months after handover. The 12 unavailable households are excluded from second-follow-up results.
Explore the complete results.
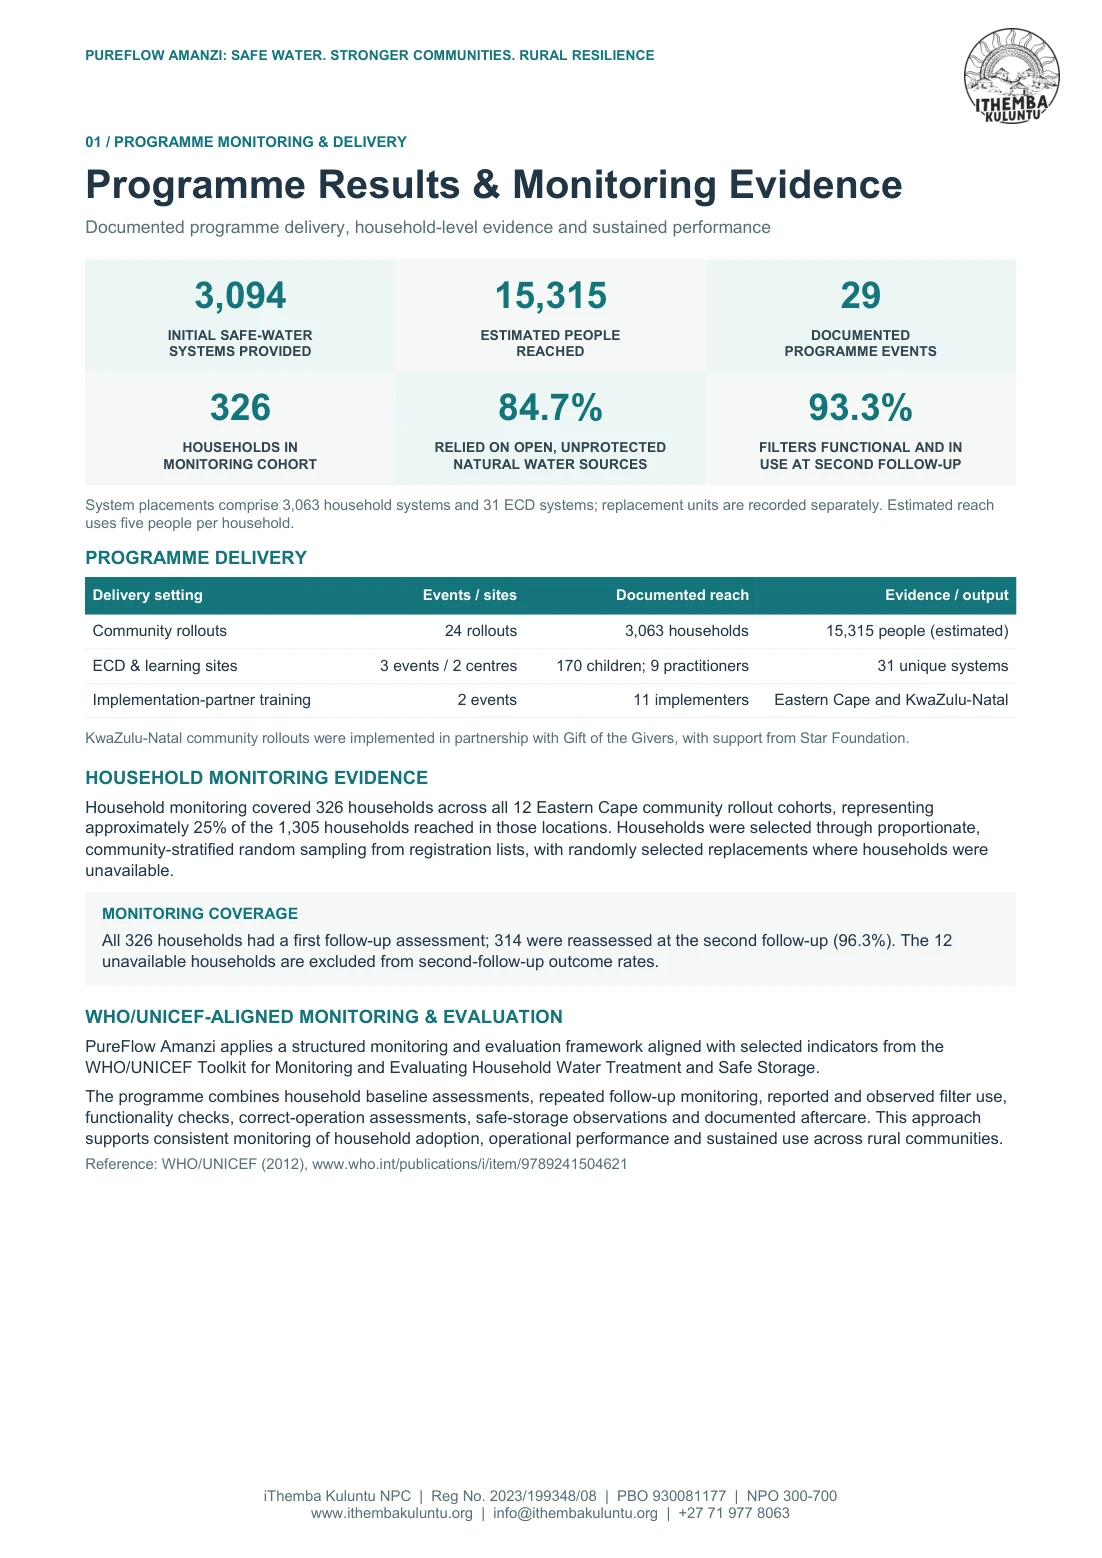
Four pages covering documented delivery, household baseline, repeated monitoring results, aftercare, ECDs and the event register.
Download the full report